Infographics for SEO: How to Increase Engagement?

Qasim Agha Khan
Jan 18, 2025
Jan 18, 2025
Share this post:
Table Of Contents
Infographics combine the best of both worlds—information and visuals. You can call them multitaskers of the content world
Did you ever try to explain a complex idea to a friend using just words? It is like painting a sunset with only black and white. Sure, it gets the message across, but does it captivate?
Text-only communication is risky nowadays. Because people's attention spans are shorter than a TikTok video. The truth is, that your audience is drawn to simplicity, clarity, and a hint of fun.
Now, here’s the problem: your content may be top-notch, but if it’s not visually appealing, it risks being overlooked. Walls of text? They serve as a "Do Not Disturb" indicator for your readers. And with competition fiercer than ever, it is no longer enough to grab attention—you need to hold it and drive action.
Then what is the solution??
Infographics—the secret sauce for engagement. They are like the ultimate glow-up for your content—they turn boring facts into beautiful, easy-to-digest gems. They educate, entertain, and most importantly, convert.
Curious how to create these engaging visuals and use them to supercharge your SEO? Keep reading. By the end of this blog, you will know why infographics are essential. And how to leverage them to skyrocket your online presence. Let’s turn your content from “meh” to “magnificent”!
To start, I have a simple question: would you rather read a 500-word essay about climate change or take a quick look at a colorful infographic that breaks it all down into easy-to-understand chunks?
No contest, right?
No matter how valuable your content is, poor presentation can leave readers unimpressed. Users scan rather than read. Infographics combine the best of both worlds—information and visuals. You can call them multitaskers of the content world. They are creative tools that combine data, visuals, and storytelling to communicate information quickly and effectively.
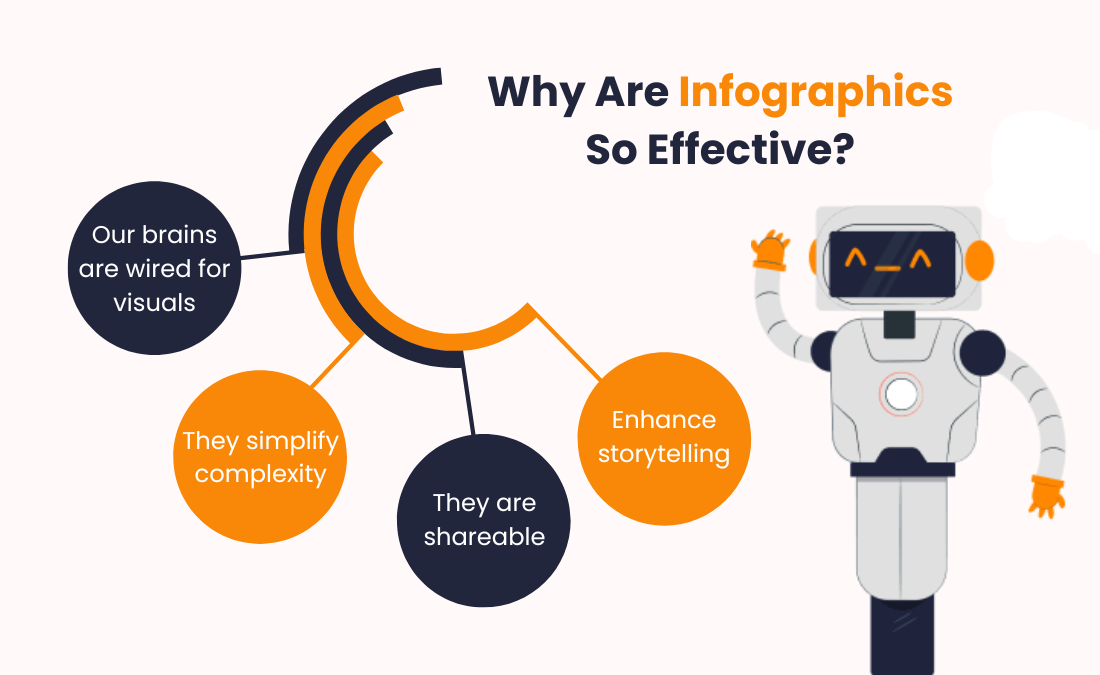
Here’s why they work:
Our brains are wired for visuals: Research shows that humans process visuals 60,000 times faster than text, according to Redesign2. So, infographics are a mental shortcut to understanding.
They simplify complexity: Imagine trying to decode the GDP growth of 10 countries through text. Exhausting! But a chart? Instant clarity and comprehension.
They are shareable: People are twice as likely to share infographics compared to text-based content. This makes them ideal for amplifying reach.
Boost retention and recall: Visuals help readers remember key information longer. Studies reveal that people recall 65% of visuals after three days.
Enhance storytelling: Infographics add depth to narratives. It turns dry data into engaging visual stories that captivate and inform audiences effectively.
There is only one thing this means for SEO: better engagement metrics. Lower bounce rates, longer on-site time, and more backlinks—all of which search engines love.
What’s worse, search engines like Google are evolving. They put the user experience first by looking at things like time-on-page and bounce rates. Your rankings suffer if your visitors aren't staying on your page. Plain text is no longer sufficient.
Okay, so you know infographics are cool. But how do they actually boost your SEO? Let’s dive into the details:
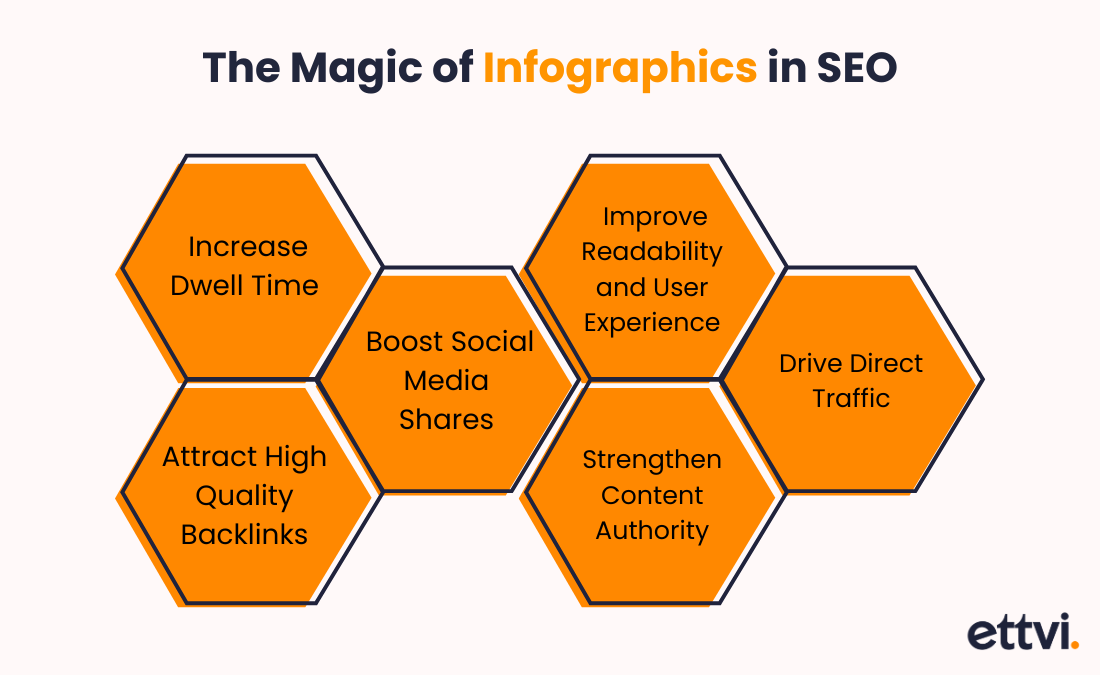
Think of dwell time as a first date with your website. The longer visitors stay, the more they will enjoy your company. Infographics capture attention instantly. They encourage readers to scroll, explore, and absorb your content. They make visitors stay longer by providing variety. It reduces the chances of them bouncing to another site.
A data-heavy infographic is like a party where everyone wants to be invited. Websites, blogs, and even news outlets will link back to your content. It will give your domain a much-needed SEO boost. These backlinks signal search engines that your content is authoritative. It helps to improve rankings and drive organic traffic over time.
Platforms like Pinterest, Instagram, and even LinkedIn are perfect for infographics. When your content is shared widely, it amplifies your brand reach and drives more traffic back to your site. A visually stunning infographic increases the likelihood of users engaging, liking, and commenting. Which further enhances your online visibility.
Infographics make complex topics easy to digest. It improves overall readability. An enjoyable user experience is achieved by combining concise text with visuals. A better experience translates into more time on your site and increased chances of conversion or action. HubSpot reported that articles with visuals get 94% more views than text-only posts.
A well-researched infographic reflects credibility. It urges readers to trust your brand. It positions you as an authority in your niche and encourages return visits. Readers associate your brand with valuable insights. This ultimately builds loyalty and positive sentiment.
Infographics are often embedded or shared across platforms with your site link. It drives direct traffic. Users are more likely to click back to your site for detailed information. This additional traffic increases visibility. Also, it provides more opportunities for engagement and conversion.
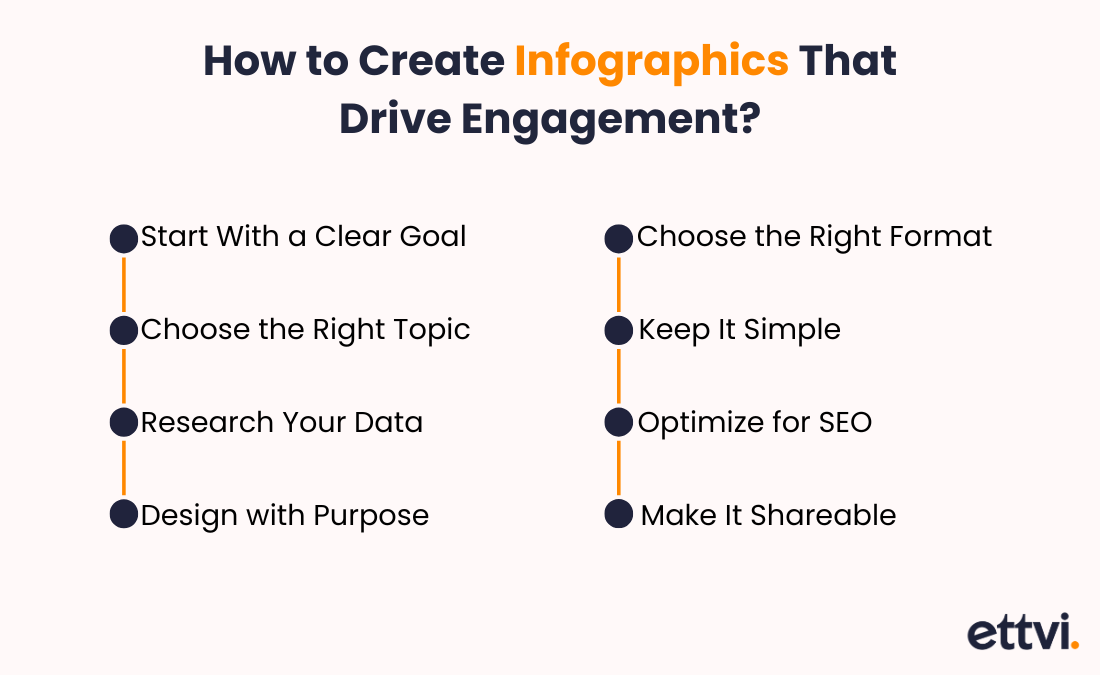
So, how do you craft infographics that not only look stunning but also boost your SEO? Here’s a step-by-step guide:
Every great infographic begins with a purpose. Are you trying to educate, entertain, or promote? Define your objective before diving in.
Think about your audience’s biggest questions or pain points. What are they searching for? Tools like Google Trends or Answer the Public can help you identify trending topics. For example, if you run a fitness blog, an infographic on “10 Simple Exercises for Busy Professionals” could be a hit.
Good infographics run on reliable data. Statistics give your infographics credibility. Use credible sources like government reports, academic studies, or industry statistics. For example, you could highlight how 94% of users are more likely to trust a website with compelling visuals.
Think of your infographic as a story. Use a logical flow, with clear headings and sections. Tools like Canva, Venngage, and Piktochart make designing user-friendly and fun. Consider using a video maker to further enhance your infographic into a dynamic visual story. Several video maker free of cost available in the SERPs have awesome features. Animated infographics or short explainer videos can grab attention faster. They make your content more engaging and shareable. Remember to stick to your brand’s color palette and fonts for consistency.
Infographics come in many flavors:
Timeline Infographics: Perfect for showcasing a process or historical data.
Statistical Infographics: Ideal for presenting numbers and percentages.
Comparative Infographics: Use these to highlight pros and cons or differences between two items.
Avoid clutter at all costs. Stick to a clean, consistent color palette, readable fonts, and logical layouts. Don’t overload your infographic. Pay attention to one key idea or theme and break it into digestible chunks. Use minimal text, clear visuals, and bold headers.
Add descriptive file names, alt text, and captions. Use keywords naturally in the title, alt text and meta description. For example, instead of naming your file “image1.png,” go for something like “seo-friendly-infographic-tips.png” or “seo-infographics.png”. Also, compress your infographic to maintain fast loading speeds.
Add social sharing buttons near your infographic. Embed codes to encourage sharing. A strong call-to-action, like “Pin this for later” or “Share this with your network,” works wonders.
Avoid these mistakes with your infographic before you send it out into the world:
Too much information overwhelms your audience. Focus on the most relevant stats and insights.
Over 50% of web traffic comes from mobile devices. Ensure your infographic is responsive and looks great on smaller screens.
An infographic without a call to action is like a car without a destination. Always guide your audience to the next step, whether it’s reading another blog, downloading a resource, or sharing your content.
Infographics are versatile. Here’s how you can repurpose them:
Embed in Blogs: Use them as visual aids in your articles.
Share on Social Media: Post snippets on Instagram or Pinterest.
Use in Emails: Include a mini infographic to boost email engagement rates.
Create Video Content: Turn static infographics into engaging animations.
Always remember these tips to boost your infographic reach:
Share your infographic on platforms like Reddit, Quora, and niche forums to attract targeted traffic.
Add share buttons and even a friendly note like, “Loved this infographic? Share it with your network!”
Use tools like Google Analytics to track how your infographic impacts key metrics like bounce rate and time on site.
If you want to get more people to interact with your content, infographics are a great way to do it. They can help you get backlinks and improve your SEO. You can turn complicated ideas into information goldmines that people will want to share by combining interesting visuals with useful insights.
Now it’s your turn: Ready to create an infographic that skyrockets your engagement and SEO rankings? Dive in, experiment, and let your creativity shine. The results might just blow your mind—and your competitors—out of the water.
Jan 18, 2025
Qasim Agha Khan is a seasoned SEO consultant and digital entrepreneur with over a decade of experience helping businesses improve their online visibility and drive organic traffic. He is also the author of the bestselling book '10 Minutes SEO,' a comprehensive guide to mastering search engine optimization strategies in a concise and actionable manner.


Copyright © 2025 ETTVI | All Rights Reserved
Get in touch with our support team.